readxl::read_xlsx(
"C:/Dataset/ghana.xlsx",
skip = 3,
sheet = "2000 - 2020",
range = "A4:ARD262") %>%
select(ends_with("20")) %>%
filter(BTOTL_2020==29340248) %>%
pivot_longer(cols = BTOTL_2020:F80PL_2020) %>%
filter(!name %in% c("BTOTL_2020", "MTOTL_2020", "FTOTL_2020") ) %>%
filter(!str_detect(name, "^B")) %>%
mutate(
sex = str_extract(name, "^\\w"),
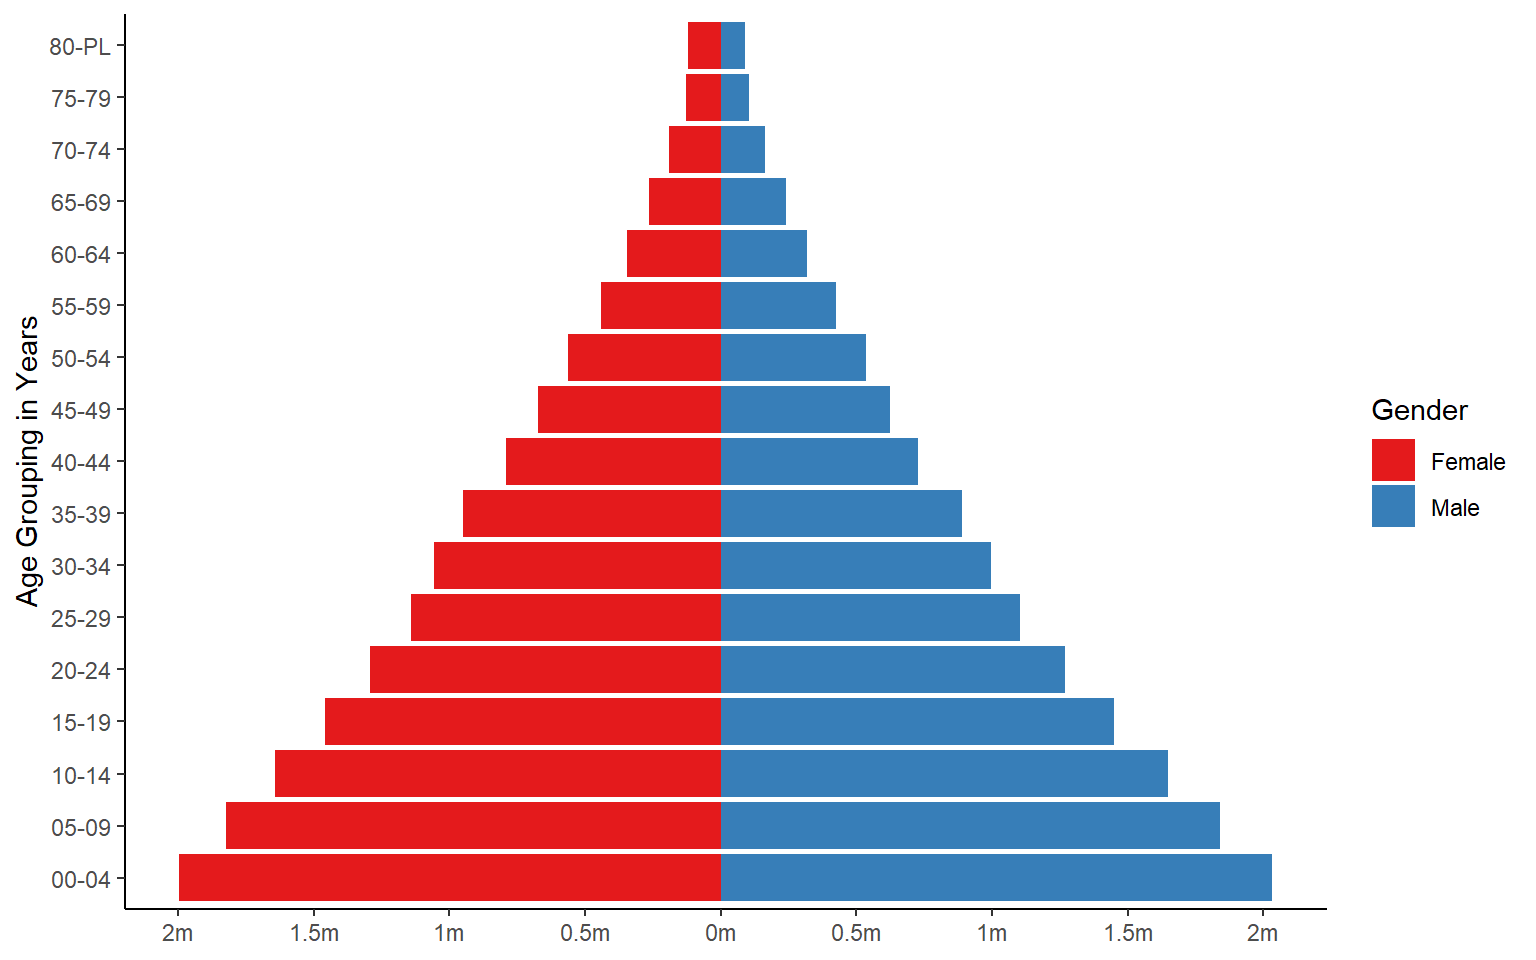
agegrp = str_c(str_sub(name, 2, 3),"-", str_sub(name, 4,5)),
Population = ifelse(sex == "F", -value, value)) %>%
ggplot(aes(x = agegrp, y = Population, fill = sex)) +
geom_bar(stat = "identity") +
labs(x = "Age Grouping in Years", y = NULL, fill = "Gender") +
scale_y_continuous(
breaks = seq(-2000000, 2000000, 500000),
labels = paste0(as.character(c(seq(2.0, 0.5, -0.5),
seq(0, 2.0, 0.5))), "m")) +
coord_flip() +
scale_fill_brewer(palette = "Set1", labels = c("Female","Male")) +
theme_classic()