dataF %>%
summarize(across(contains(c("mcv","hb", "wbc", "mch")),mean)) %>%
pivot_longer(cols = mcv1:avemchc) %>%
filter(!(name %in% c("avemcv","avehb", "avewbc", "avemch", "avemchc"))) %>%
mutate(name2 = str_extract(name, "^\\D*"),
name = toupper(name)) %>%
ggplot(aes(x = name, y = value, color = name2))+
geom_segment(aes(xend = name, yend = 0), show.legend = F) +
geom_point(size = 6, show.legend = F) +
geom_text(aes(label = round(value, 1)), col = "black", size =2)+
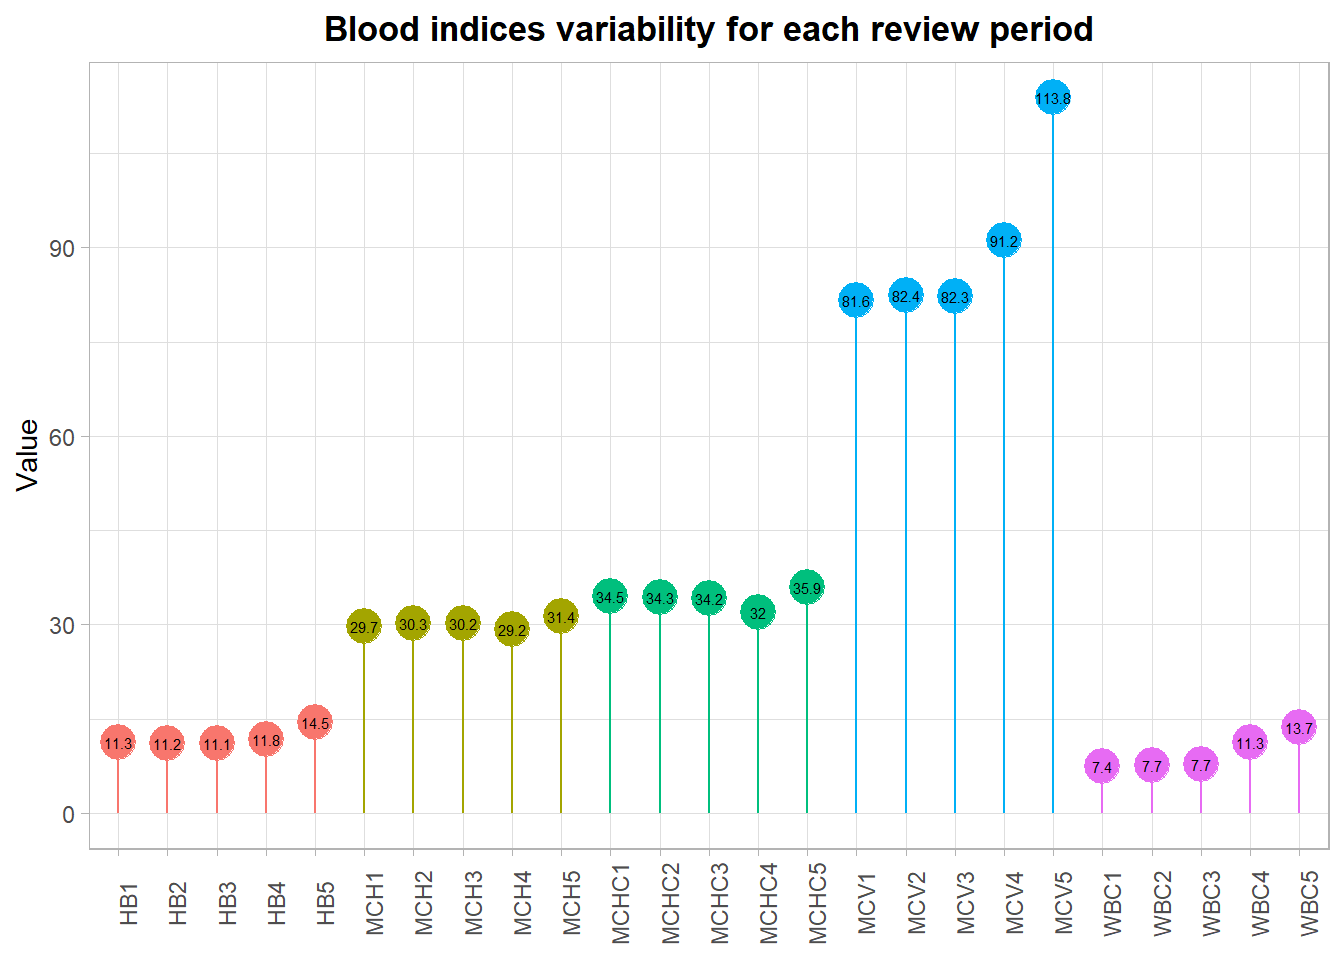
labs(title = "Blood indices variability for each review period",
y = "Value",
x = NULL)+
theme_light() +
theme(
axis.text.x = element_text(angle = 90),
plot.title = element_text(hjust = 0.5, face = "bold")
)