dataF %>%
select(id, contains("mcv")) %>%
arrange() %>%
pivot_longer(cols = c(mcv1:mcv5)) %>%
mutate(tms = unclass(factor(name))) %>%
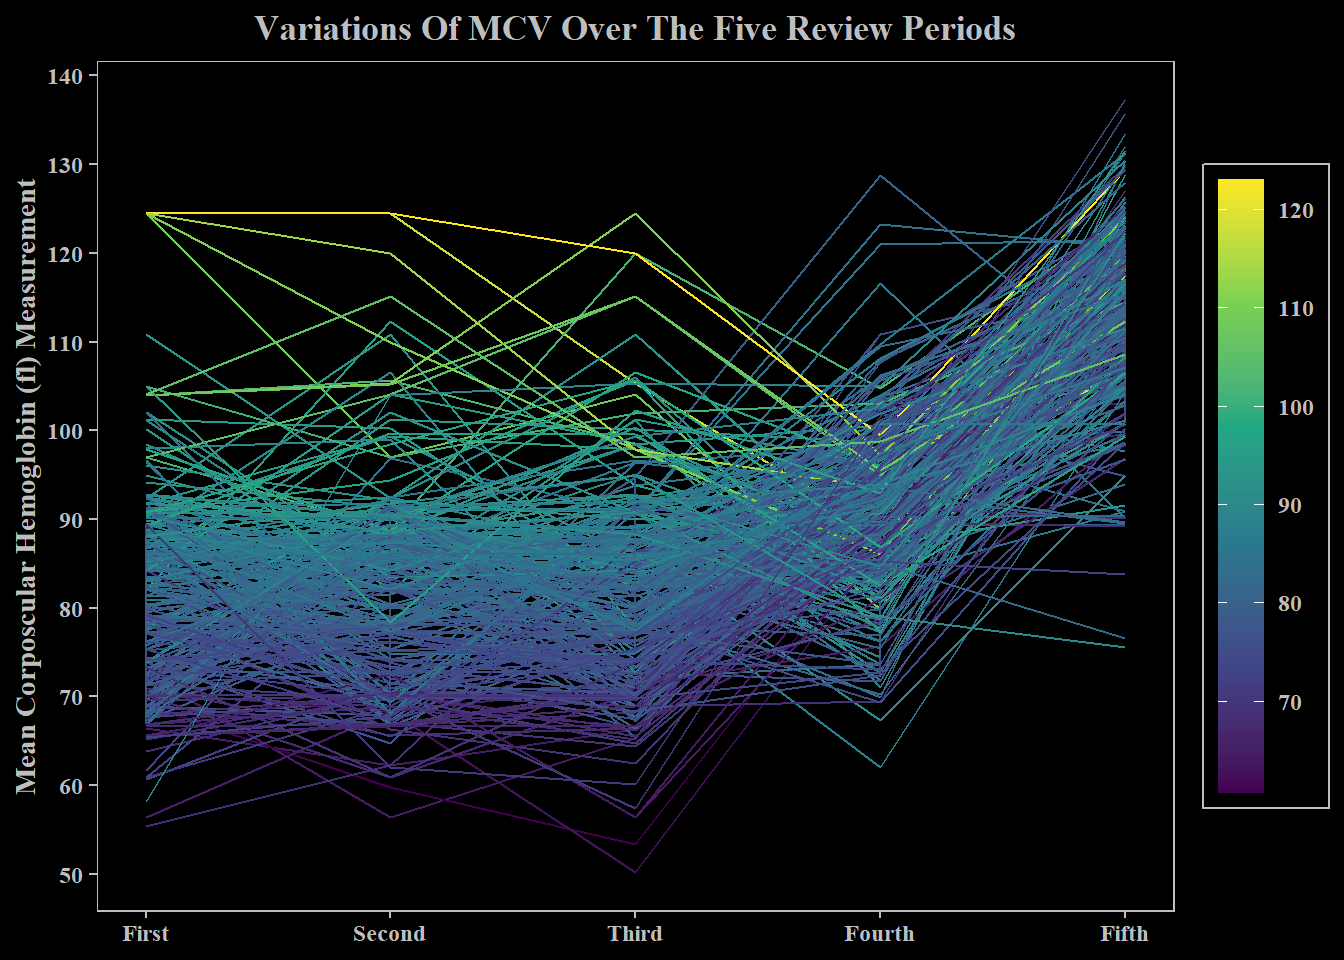
ggplot(aes(x = tms, y = value, group = id, color = avemcv)) +
geom_line() +
labs(x = NULL,
title = "Variations Of MCV Over The Five Review Periods") +
scale_x_continuous(
breaks = c(1:5),
limits = c(1,5),
labels = c("First","Second", "Third", "Fourth", "Fifth"))+
scale_y_continuous(
name= "Mean Corposcular Hemoglobin (fl) Measurement",
breaks = seq(50, 140, 10)) +
scale_color_viridis_c(breaks = seq(50, 140, 10)) +
theme(
plot.background = element_rect(fill = "black", colour = "black"),
panel.background = element_rect(fill = "black", color = "grey"),
panel.grid = element_blank(),
axis.text = element_text(
colour = "grey", face = "bold", family = "serif"),
axis.ticks = element_line(colour = "grey"),
axis.title = element_text(
colour = "grey", face = "bold", family = "serif"),
plot.title = element_text(
colour = "grey",hjust = 0.5, face = "bold", family = "serif"),
legend.background = element_rect(
fill = "black", colour = "grey"),
legend.title = element_blank(),
legend.text = element_text(
colour = "grey", face = "bold", family = "serif"),
legend.key.height = unit(0.64, "in")
)